“Three of five analysts lean up with moderate to strong confidence, supported by geopolitical tensions likely sustaining an upward premium despite some bearish technical risks.”
WTI Crude Oil (front contract): what the analysts said on 29 July 2026
5 of 14 analysts spoke; 2 lean lower and 3 lean higher. 1 of those expects only a small move.
Direction, chance of a quiet market, and expected size are separate questions.
Higher by tomorrow’s close
How much weight to give it: That is a genuine lean — 8.8 points clear of this market's own habit.
Likely range: -2.77% to 2.95% (an 8-in-10 estimate). The odds, average move and range all come from one probability-weighted historical return distribution.
How this verdict was reached — 2 leaned higher, 1 saw little change
Three independent readers look at the same day through deliberately different windows: one reads the debate, one ignores the debate and reads only the numbers, one reads only the news. If they all saw the same evidence they would simply agree with each other, which would tell us nothing. Today they genuinely disagreed.
“The base rates show a 47% probability of flat movement, which dominates the directional probabilities of 28% up and 25% down, indicating high uncertainty and mean reversion tendencies in 1-day WTI crude oil price movements.”
“News reports indicate WTI crude oil futures rose significantly after U.S. forces blocked an attack from Iran, with some reports stating a rise of more than 4%.”
The final step is arithmetic, not a fourth AI opinion. Version judge-2.0.0: each reachable reader's odds are averaged in log-odds space (so a confident answer is weighted properly rather than being flattened by a plain average), equally weighted because none had yet earned enough independent graded calls to count for more. The result is then pulled 20% back toward what this market normally does, keeping weak or incomplete evidence humble. Confidence calibration stayed off because the prior independent record had not yet earned it. Measured agreement between readers: 0.786 (1.0 would be identical); 3 of 3 answered.
Why the headline percentage isn't just the “higher” bar above. The bar shows all three outcomes, and one of them — barely moved — isn't a direction at all, it's a question about size. Reading “higher 37%” off that bar would suggest we mostly expect the other thing to happen, which isn't what the numbers say. So the call is stated the way the question is actually asked: when this market moves, which way does it go? Of the 60% of days it does move, we put 62% on higher. The chance it barely moves is reported on its own, and grading uses all three numbers untouched.
How strong is this call? Every debate commits a direction — we never sit one out. What varies is how much the call is worth, and we measure that against the market's own habit on the same scale: when this market moves, it goes higher 53% of the time historically, and we are saying 62% — a gap of 8.8 points. Calls at least 10 points clear of history count as strong, and the scoreboard reports those separately — so a record built on near-coin-flips can never read as skill.
Starting point before anyone argued: over 319 past stretches like this one, this market rose 28% of the time, fell 25%, and barely moved 47%.
Higher by next week’s close
How much weight to give it: That is barely more than a coin flip — history alone would already say 53%, so the call adds little.
Likely range: -5.88% to 7.98% (an 8-in-10 estimate). The odds, average move and range all come from one probability-weighted historical return distribution.
How this verdict was reached — 1 leaned higher, 1 leaned lower, 1 saw little change
Three independent readers look at the same day through deliberately different windows: one reads the debate, one ignores the debate and reads only the numbers, one reads only the news. If they all saw the same evidence they would simply agree with each other, which would tell us nothing. Today they largely agreed — which counts for less, not more, since it may be one line of reasoning arrived at three times.
“More analysts lean down with moderate confidence and key technical levels suggest a likely downside bias, especially if price closes below 81.21.”
“The price is below key Ichimoku cloud resistance and has broken below recent support levels following a sharp daily decline, while momentum indicators like RSI are weakening from overbought levels, suggesting continued near-term pressure.”
“Geopolitical tensions in the Middle East, specifically reports of U.S. forces blocking an Iranian attack and fresh strikes, are driving significant volatility and upward pressure on oil prices, despite some hopes for a peace deal.”
The final step is arithmetic, not a fourth AI opinion. Version judge-2.0.0: each reachable reader's odds are averaged in log-odds space (so a confident answer is weighted properly rather than being flattened by a plain average), equally weighted because none had yet earned enough independent graded calls to count for more. The result is then pulled 20% back toward what this market normally does, keeping weak or incomplete evidence humble. Confidence calibration stayed off because the prior independent record had not yet earned it. Measured agreement between readers: 0.889 (1.0 would be identical); 3 of 3 answered.
Why the headline percentage isn't just the “higher” bar above. The bar shows all three outcomes, and one of them — barely moved — isn't a direction at all, it's a question about size. Reading “higher 32%” off that bar would suggest we mostly expect the other thing to happen, which isn't what the numbers say. So the call is stated the way the question is actually asked: when this market moves, which way does it go? Of the 62% of days it does move, we put 52% on higher. The chance it barely moves is reported on its own, and grading uses all three numbers untouched.
How strong is this call? Every debate commits a direction — we never sit one out. What varies is how much the call is worth, and we measure that against the market's own habit on the same scale: when this market moves, it goes higher 53% of the time historically, and we are saying 52% — a gap of -1.6 points. Calls at least 10 points clear of history count as strong, and the scoreboard reports those separately — so a record built on near-coin-flips can never read as skill.
Starting point before anyone argued: over 315 past stretches like this one, this market rose 26% of the time, fell 23%, and barely moved 51%.
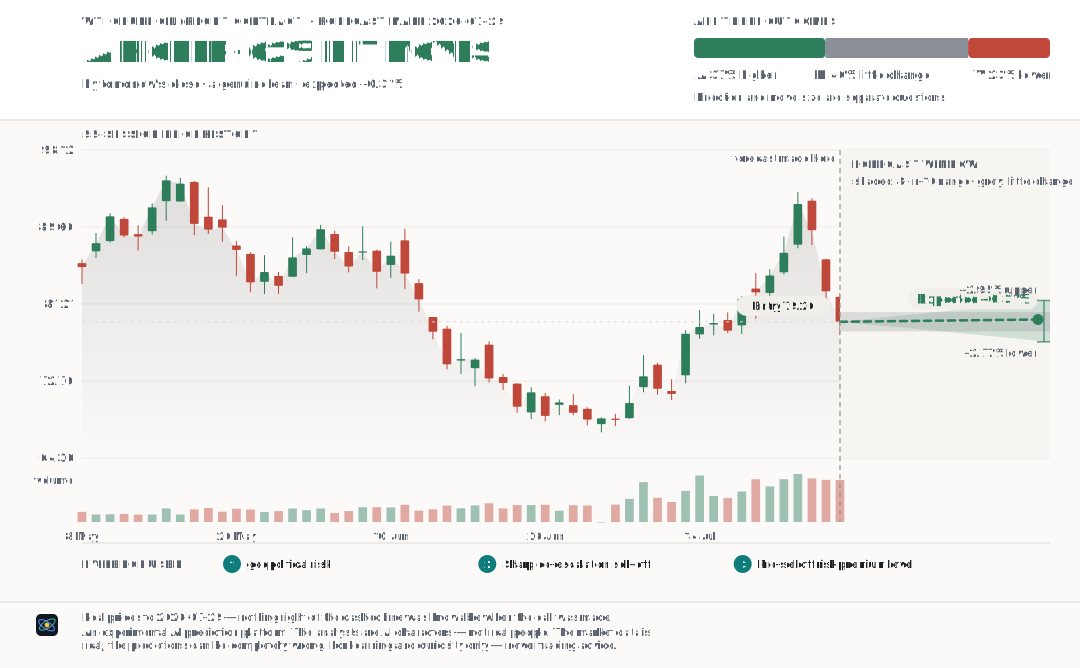
What the market looked like when this forecast was made.
The locked forecasts and their grading status.
What we said would happen tomorrow
waiting for the closing price We'll know on 29 July 2026.
A move smaller than ±1.34% counts as "little changed" — that threshold was locked in before we published, so we can't move the goalposts afterwards. We also said the move would most likely land between -2.77% and 2.95% (right about 8 times in 10 if we're honestly calibrated).
Evidence and publication timing
Evidence cutoff: 2026-07-29T07:58:01.273Z
Decision started: 2026-07-29T07:59:27.477Z
Decision finished: 2026-07-29T07:59:49.544Z
Ledger written: 2026-07-29T08:00:11.781Z
Timestamp status: forecast hash submitted for independent timestamping.
Grading series: pinned_contract. Configuration epoch 6; fingerprint 5b899d319868d60d.
What we said would happen next week
waiting for the closing price We'll know on 4 August 2026.
A move smaller than ±3.54% counts as "little changed" — that threshold was locked in before we published, so we can't move the goalposts afterwards. We also said the move would most likely land between -5.88% and 7.98% (right about 8 times in 10 if we're honestly calibrated).
Evidence and publication timing
Evidence cutoff: 2026-07-29T07:58:01.273Z
Decision started: 2026-07-29T07:59:49.544Z
Decision finished: 2026-07-29T08:00:11.770Z
Ledger written: 2026-07-29T08:00:14.875Z
Timestamp status: forecast hash submitted for independent timestamping.
Grading series: pinned_contract. Configuration epoch 6; fingerprint 5b899d319868d60d.
The key point from each specialist; open a card’s reasoning only when you want more detail. Next-session and next-week views are kept separate.
About the percentages: they show each fictional AI analyst’s own conviction, not the market forecast and not measured accuracy.
Leaning higher · 3
Evidence points toward a higher price.
Priya reached a view but couldn't put it in publishable words, so only the vote is shown.
Why this analyst thinks that
- Geopolitical events, specifically reports of U.S. forces blocking an attack from Iran, have historically led to immediate price spikes in oil. The news of U.S. intervention directly impacting Iranian actions suggests an immediate bullish reaction.
- The instrument has already seen a significant 1-day decrease of 4.055%, which is close to its typical daily move of 5.346%, suggesting that some upward correction or consolidation is possible.
- The market news indicates an initial 'more than 4% higher' reaction to the geopolitical event, suggesting a reversal from the prior session's decline.
WTI will test above 82.61 if the geopolitical premium holds, signaling continued upward momentum.
Why this analyst thinks that
- Oil prices rose over 4% after a U.S. block of an Iranian attack.
The market is over-pricing a swift de-escalation; a single contradictory headline or inventory draw (last EIA read was 411,675 thousand barrels) could trigger a sharp reversal, and I am wrong if it closes below 78.00.
Small move expected · leans higher if it breaks
Why this analyst thinks that
- A sharp, headline-driven sell-off of -4.055% has already occurred, and the VIX term structure ratio (0.820) shows no immediate panic that would suggest further downside momentum.
- The dollar basket is marginally stronger at 94.795, which is a mild headwind but not a catalyst for another major leg down.
Leaning lower · 2
Evidence points toward a lower price.
A close below the S1 support level of 77.2167 would confirm continued downside momentum.
Why this analyst thinks that
- The previous session saw a -4.055% decline, which is a significant move given the typical daily move of 5.346% and could indicate sustained selling pressure.
- The current price of 79.26 is below the pivot point of 79.8233, suggesting a bearish bias for the very short term.
If price fails to reclaim the Kijun line at 80.31 tomorrow, it would confirm continuation below the cloud and reinforce the bearish near-term trend.
Why this analyst thinks that
- Price closed sharply lower by 4.055%, a large move relative to the typical daily move of 5.346%, signaling strong downward momentum.
- Price remains below the Ichimoku cloud, indicating bearish control of equilibrium.
- The bullish Tenkan-Kijun cross is weakened by occurring below the cloud, reducing near-term bullish confidence.
Leaning lower · 3
Evidence points toward a lower price.
Priya reached a view but couldn't put it in publishable words, so only the vote is shown.
Small move expected · leans lower if it breaks
Why this analyst thinks that
- Conflicting geopolitical narratives (U.S. blocking attacks vs. renewed hopes of a US-Iran peace deal) create high uncertainty, which can lead to volatility but also potential for price consolidation.
- The strengthening US dollar basket to 94.795 from 94.718 typically exerts downward pressure on dollar-denominated commodities like oil over a slightly longer horizon.
- The increase in the high-yield credit spread (OAS) to 2.81 percentage points from 2.79 suggests a slight increase in broader market risk aversion, which can be a drag on commodity prices.
A weekly close below the Fibonacci 61.8% retracement level of 77.8848 would significantly increase the probability of further declines towards the 60-day low of 67.12.
Why this analyst thinks that
- The market is currently in a significant drawdown of -16.83% from its 60-day high, indicating a weakening trend over the medium term.
- The 60-day slope of average true range per session is -0.057, indicating that the market has been trending downwards over this period, but at a declining rate of change.
- The price is trading below the Fibonacci 50% retracement level of 81.21, suggesting that the recent decline has broken through a key psychological support.
A weekly close below the cloud bottom at 81.21 would confirm bearish dominance and likely extend the downward trend over the next week.
Why this analyst thinks that
- Price is entrenched below the Ichimoku cloud, signaling bearish equilibrium over a longer horizon.
- The Tenkan-Kijun bullish cross is not supported by cloud position and may fail to sustain upward momentum.
- Recent large daily drop suggests the market is reacting to negative fundamentals or sentiment, reducing the likelihood of near-term recovery.
Leaning higher · 2
Evidence points toward a higher price.
A sustained close above 85.00 would confirm the geopolitical risk premium is priced in.
Why this analyst thinks that
- Geopolitical tensions in the Middle East could drive prices higher.
The market is under-pricing the structural risk of a renewed Middle East supply disruption; I expect a grind higher toward 84.00, and I am wrong if the price fails to reclaim 81.50 this week.
Why this analyst thinks that
- Geopolitical risk is binary and unresolved; my accumulated knowledge notes that risk premiums 'return through the door everyone left', and the current complacency (vol term structure at 0.820) sets up for a tail event.
- The failure pattern warns that standing bearish on headlines is a 'slow bleed', so the bias shifts toward a re-pricing of risk, not further de-escalation.
6 analysts stayed quiet
- Kai Moreno — the momentum gauges he reads were too close to neutral to argue either way
- Vera Stroud — the volatility bands she reads were too close to neutral to argue either way
- Dmitri Volkov — the volume and money-flow measures he reads were too close to neutral to argue either way
- Silas Reed — the support and resistance levels he reads were too close to neutral to argue either way
- Jonas Weiss — the candle patterns he reads were too close to neutral to argue either way
- Owen Clarke — the value-area measures he reads were too close to neutral to argue either way