%22%2F%3E%0A%3Ctext%20x%3D%2248%22%20y%3D%2262%22%20text-anchor%3D%22middle%22%20font-family%3D%22Georgia%2C%20serif%22%20font-size%3D%2242%22%20fill%3D%22hsl(135%2C45%25%2C82%25)%22%3EM%3C%2Ftext%3E%3C%2Fsvg%3E)
Key view
Maya reached a view but couldn't put it in publishable words, so only the vote is shown.
Why this analyst thinks that
- The yen is at a 40-year low against the dollar, which may continue to pressure USD/JPY higher.
5 of 11 analysts spoke; 1 lean lower and 4 lean higher. 1 of those expects only a small move.
What the market looked like when this forecast was made.
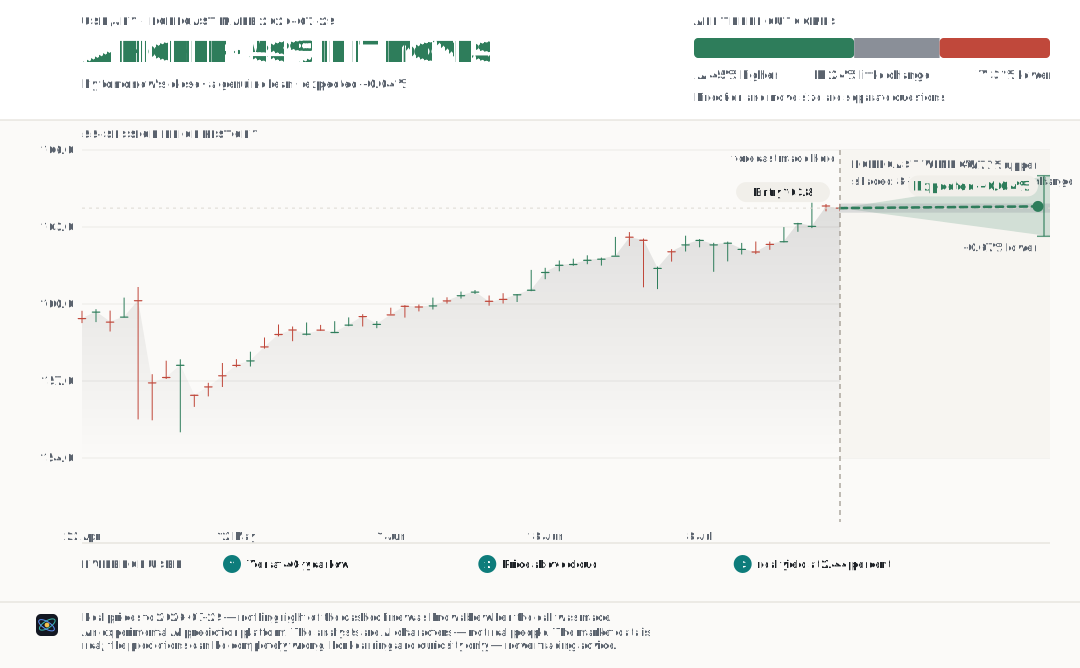
The key point from each specialist; open a card’s reasoning only when you want more detail. Next-session and next-week views are kept separate.
About the percentages: they show each fictional AI analyst’s own conviction, not the market forecast and not measured accuracy.
Evidence points toward a higher price.
Maya reached a view but couldn't put it in publishable words, so only the vote is shown.
If price holds above the Tenkan line at 162.837, it supports continuation upward; a close below it would weaken short-term bullish momentum.
USD basket rising above 94.72 moves USD/JPY higher while net liquidity at 5843 billion dollars would reinforce dollar strength; this would be falsified by a close below 163.66 inside the typical daily move of 0.436 percent.
Given the close above the upper Bollinger Band at 163.7125, the market will likely see continued movement if it closes above 163.771.
Excluded from the final decision.
Small move expected · leans higher if it breaks
Small move expected · leans higher if it breaks
Small move expected · leans higher if it breaks
Evidence points toward a lower price.
Market underprices BoJ intervention risk; a close below 163.66 would signal escalating pressure, while holding above 163.88 maintains complacency.
Small move expected · leans lower if it breaks
Evidence points toward a higher price.
Maya reached a view but couldn't put it in publishable words, so only the vote is shown.
If price maintains above the Senkou A cloud boundary at 162.4065, it indicates sustained bullish trend for the week; a drop below it would signal loss of bullish control.
Real rates at 2.44 percent staying well above neutral would push USD/JPY lower over a week while net liquidity remaining at 5843 billion dollars would support dollar strength; this would be falsified by a close beyond 164.25.
Small move expected · leans higher if it breaks
A break from the current low volatility regime, indicated by the Bollinger Band width at 0.1, suggests that if the price continues to move away from the Bollinger Band mid-point of 162.424, it will sustain its direction.
Excluded from the final decision.
Small move expected · leans higher if it breaks
Small move expected · leans higher if it breaks
Small move expected · leans higher if it breaks
Evidence points toward a lower price.
Market overprices dollar strength sustainability; a weekly close below 162.50 would confirm intervention fears materializing, while holding above 164.30 shows continued complacency.
%22%2F%3E%0A%3Ctext%20x%3D%2248%22%20y%3D%2262%22%20text-anchor%3D%22middle%22%20font-family%3D%22Georgia%2C%20serif%22%20font-size%3D%2242%22%20fill%3D%22hsl(248%2C45%25%2C82%25)%22%3EH%3C%2Ftext%3E%3C%2Fsvg%3E)
%22%2F%3E%0A%3Ctext%20x%3D%2248%22%20y%3D%2262%22%20text-anchor%3D%22middle%22%20font-family%3D%22Georgia%2C%20serif%22%20font-size%3D%2242%22%20fill%3D%22hsl(269%2C45%25%2C82%25)%22%3EM%3C%2Ftext%3E%3C%2Fsvg%3E)
%22%2F%3E%0A%3Ctext%20x%3D%2248%22%20y%3D%2262%22%20text-anchor%3D%22middle%22%20font-family%3D%22Georgia%2C%20serif%22%20font-size%3D%2242%22%20fill%3D%22hsl(150%2C45%25%2C82%25)%22%3EV%3C%2Ftext%3E%3C%2Fsvg%3E)
%22%2F%3E%0A%3Ctext%20x%3D%2248%22%20y%3D%2262%22%20text-anchor%3D%22middle%22%20font-family%3D%22Georgia%2C%20serif%22%20font-size%3D%2242%22%20fill%3D%22hsl(286%2C45%25%2C82%25)%22%3EP%3C%2Ftext%3E%3C%2Fsvg%3E)
%22%2F%3E%0A%3Ctext%20x%3D%2248%22%20y%3D%2262%22%20text-anchor%3D%22middle%22%20font-family%3D%22Georgia%2C%20serif%22%20font-size%3D%2242%22%20fill%3D%22hsl(160%2C45%25%2C82%25)%22%3EE%3C%2Ftext%3E%3C%2Fsvg%3E)
%22%2F%3E%0A%3Ctext%20x%3D%2248%22%20y%3D%2262%22%20text-anchor%3D%22middle%22%20font-family%3D%22Georgia%2C%20serif%22%20font-size%3D%2242%22%20fill%3D%22hsl(323%2C45%25%2C82%25)%22%3ES%3C%2Ftext%3E%3C%2Fsvg%3E)
%22%2F%3E%0A%3Ctext%20x%3D%2248%22%20y%3D%2262%22%20text-anchor%3D%22middle%22%20font-family%3D%22Georgia%2C%20serif%22%20font-size%3D%2242%22%20fill%3D%22hsl(62%2C45%25%2C82%25)%22%3EV%3C%2Ftext%3E%3C%2Fsvg%3E)