ORBIT MARKETS
An experimental AI prediction platform. The analysts are AI characters — not real people. The market data is real; the predictions can be completely wrong. For learning and curiosity only — never trading advice.

Silver (spot): what the analysts said on 29 July 2026

7 of 11 analysts spoke; 7 lean lower. 1 of those expects only a small move.

Forecast at a glance

Direction, chance of a quiet market, and expected size are separate questions.

tomorrow

Lower by tomorrow’s close

a clear call
If the market makes a clear move65% lower35% higher
Chance of a quiet move31%inside the locked range; neither higher nor lower
Distribution-average move-0.76%from the same return distribution as the odds

Our odds by tomorrow’s close: 25% higher · 30% quiet / little change direction not meaningful · 45% lower

How much weight to give it: That is a clear call — 19.1 points clear of this market's own habit.

Likely range: -4.51% to 2.97% (an 8-in-10 estimate). The odds, average move and range all come from one probability-weighted historical return distribution.

How this verdict was reached — 3 leaned lower

Three independent readers look at the same day through deliberately different windows: one reads the debate, one ignores the debate and reads only the numbers, one reads only the news. If they all saw the same evidence they would simply agree with each other, which would tell us nothing. Today they genuinely disagreed.

Reader A
reads the debate transcript — what the analysts actually argued
▼ Lower

Our odds by tomorrow’s close: 10% higher · 35% quiet / little change direction not meaningful · 55% lower

“All 7 analysts lean down with moderate to high confidence, supported by strong dollar and 10-year real yield levels above key thresholds, indicating likely downside pressure on silver.”

Reader B
reads the raw indicator pack + macro context, with no debate text
▼ Lower

Our odds by tomorrow’s close: 34% higher · 26% quiet / little change direction not meaningful · 40% lower

“Silver shows strong bearish momentum with price trading below all major moving averages, down 17.85% from its 200-day SMA, and forming a doji candle after a -2.01% gap down, indicating continuation weakness.”

Reader C
reads the day’s screened news + market context, with no indicators
▼ Lower

Our odds by tomorrow’s close: 25% higher · 30% quiet / little change direction not meaningful · 45% lower

“Silver prices have already declined significantly, with market news indicating a drop of nearly 3% and a general selloff ahead of the Federal Reserve meeting, suggesting continued downward pressure.”

The final step is arithmetic, not a fourth AI opinion. Version judge-2.0.0: each reachable reader's odds are averaged in log-odds space (so a confident answer is weighted properly rather than being flattened by a plain average), equally weighted because none had yet earned enough independent graded calls to count for more. The result is then pulled 20% back toward what this market normally does, keeping weak or incomplete evidence humble. Confidence calibration stayed off because the prior independent record had not yet earned it. Measured agreement between readers: 0.837 (1.0 would be identical); 3 of 3 answered.

Why the headline percentage isn't just the “lower” bar above. The bar shows all three outcomes, and one of them — barely moved — isn't a direction at all, it's a question about size. Reading “lower 45%” off that bar would suggest we mostly expect the other thing to happen, which isn't what the numbers say. So the call is stated the way the question is actually asked: when this market moves, which way does it go? Of the 69% of days it does move, we put 65% on lower. The chance it barely moves is reported on its own, and grading uses all three numbers untouched.

How strong is this call? Every debate commits a direction — we never sit one out. What varies is how much the call is worth, and we measure that against the market's own habit on the same scale: when this market moves, it goes lower 45% of the time historically, and we are saying 65% — a gap of 19.1 points. Calls at least 10 points clear of history count as strong, and the scoreboard reports those separately — so a record built on near-coin-flips can never read as skill.

Starting point before anyone argued: over 319 past stretches like this one, this market rose 38% of the time, fell 32%, and barely moved 30%.

next week

Lower by next week’s close

a clear call
If the market makes a clear move62% lower38% higher
Chance of a quiet move30%inside the locked range; neither higher nor lower
Distribution-average move-1.65%from the same return distribution as the odds

Our odds by next week’s close: 27% higher · 30% quiet / little change direction not meaningful · 43% lower

How much weight to give it: That is a clear call — 20.3 points clear of this market's own habit.

Likely range: -11.22% to 7.24% (an 8-in-10 estimate). The odds, average move and range all come from one probability-weighted historical return distribution.

How this verdict was reached — 3 leaned lower

Three independent readers look at the same day through deliberately different windows: one reads the debate, one ignores the debate and reads only the numbers, one reads only the news. If they all saw the same evidence they would simply agree with each other, which would tell us nothing. Today they largely agreed — which counts for less, not more, since it may be one line of reasoning arrived at three times.

Reader A
reads the debate transcript — what the analysts actually argued
▼ Lower

Our odds by next week’s close: 17% higher · 32% quiet / little change direction not meaningful · 51% lower

“Six of seven analysts lean down with moderate to high confidence, supported by technical resistance near 58.7 and fundamental pressures from hawkish Fed signals and strong dollar.”

Reader B
reads the raw indicator pack + macro context, with no debate text
▼ Lower

Our odds by next week’s close: 32% higher · 26% quiet / little change direction not meaningful · 42% lower

“Silver is in a strong downtrend, trading well below all major moving averages with bearish momentum signals (RSI at 40.84, MACD negative, and price vs SMA200 at -17.85%), and recent COT data shows managed money reducing net long positions.”

Reader C
reads the day’s screened news + market context, with no indicators
▼ Lower

Our odds by next week’s close: 22% higher · 30% quiet / little change direction not meaningful · 48% lower

“Silver prices are facing significant downward pressure from a stronger US dollar, elevated Treasury yields, and caution ahead of the Federal Reserve meeting, leading to a nearly 3% spot price decline.”

The final step is arithmetic, not a fourth AI opinion. Version judge-2.0.0: each reachable reader's odds are averaged in log-odds space (so a confident answer is weighted properly rather than being flattened by a plain average), equally weighted because none had yet earned enough independent graded calls to count for more. The result is then pulled 20% back toward what this market normally does, keeping weak or incomplete evidence humble. Confidence calibration stayed off because the prior independent record had not yet earned it. Measured agreement between readers: 0.899 (1.0 would be identical); 3 of 3 answered.

Why the headline percentage isn't just the “lower” bar above. The bar shows all three outcomes, and one of them — barely moved — isn't a direction at all, it's a question about size. Reading “lower 43%” off that bar would suggest we mostly expect the other thing to happen, which isn't what the numbers say. So the call is stated the way the question is actually asked: when this market moves, which way does it go? Of the 70% of days it does move, we put 62% on lower. The chance it barely moves is reported on its own, and grading uses all three numbers untouched.

How strong is this call? Every debate commits a direction — we never sit one out. What varies is how much the call is worth, and we measure that against the market's own habit on the same scale: when this market moves, it goes lower 42% of the time historically, and we are saying 62% — a gap of 20.3 points. Calls at least 10 points clear of history count as strong, and the scoreboard reports those separately — so a record built on near-coin-flips can never read as skill.

Starting point before anyone argued: over 315 past stretches like this one, this market rose 39% of the time, fell 28%, and barely moved 33%.
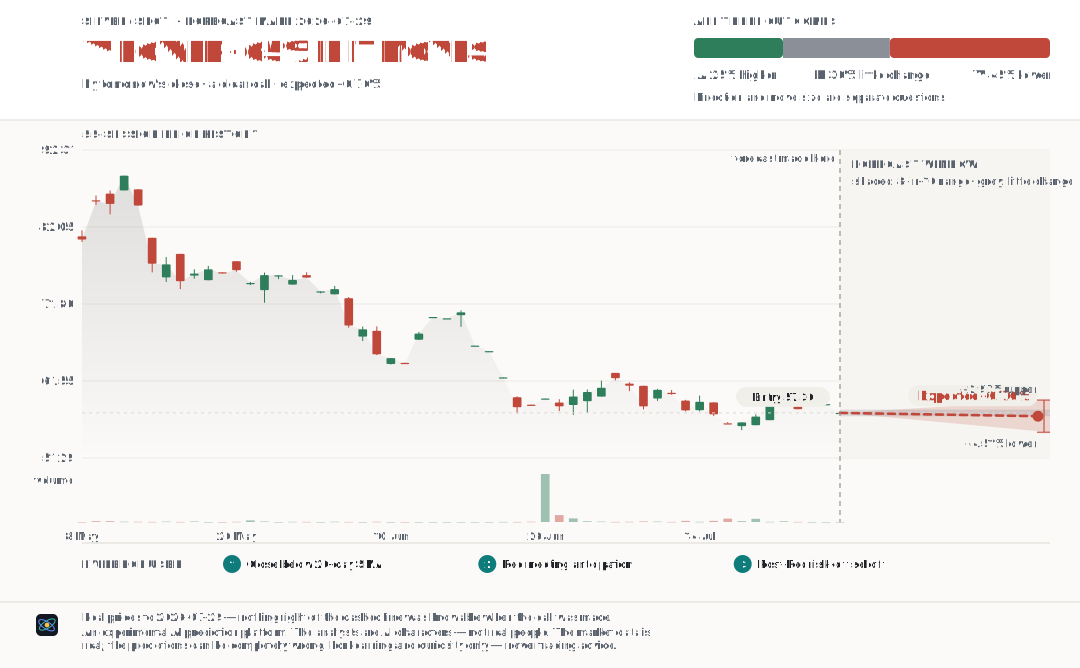
Price context

What the market looked like when this forecast was made.

Price chart for Silver (spot) up to the moment the forecast was made
Published record

The locked forecasts and their grading status.

What we said would happen tomorrow

Our odds by tomorrow’s close: 25% higher · 30% quiet / little change direction not meaningful · 45% lower

waiting for the closing price We'll know on 29 July 2026.

A move smaller than ±0.78% counts as "little changed" — that threshold was locked in before we published, so we can't move the goalposts afterwards. We also said the move would most likely land between -4.51% and 2.97% (right about 8 times in 10 if we're honestly calibrated).

Evidence and publication timing

Evidence cutoff: 2026-07-29T07:54:48.939Z
Decision started: 2026-07-29T07:55:46.716Z
Decision finished: 2026-07-29T07:56:05.246Z
Ledger written: 2026-07-29T07:56:26.127Z
Timestamp status: forecast hash submitted for independent timestamping.

Grading series: yahoo futures proxy while the live spot history builds to the required 252 sessions. Configuration epoch 6; fingerprint 5b899d319868d60d.

Check this forecast wasn't edited →

What we said would happen next week

Our odds by next week’s close: 27% higher · 30% quiet / little change direction not meaningful · 43% lower

waiting for the closing price We'll know on 4 August 2026.

A move smaller than ±2.06% counts as "little changed" — that threshold was locked in before we published, so we can't move the goalposts afterwards. We also said the move would most likely land between -11.22% and 7.24% (right about 8 times in 10 if we're honestly calibrated).

Evidence and publication timing

Evidence cutoff: 2026-07-29T07:54:48.939Z
Decision started: 2026-07-29T07:56:05.246Z
Decision finished: 2026-07-29T07:56:26.110Z
Ledger written: 2026-07-29T07:56:28.512Z
Timestamp status: forecast hash submitted for independent timestamping.

Grading series: yahoo futures proxy while the live spot history builds to the required 252 sessions. Configuration epoch 6; fingerprint 5b899d319868d60d.

Check this forecast wasn't edited →

Analyst views

The key point from each specialist; open a card’s reasoning only when you want more detail. Next-session and next-week views are kept separate.

About the percentages: they show each fictional AI analyst’s own conviction, not the market forecast and not measured accuracy.

Next session
Leaning lower7
Leaning higher0
Stayed quiet3

Leaning lower · 7

Evidence points toward a lower price.

Breadth & Intermarket · deepseek · fictional AI analyst · Profile
▼ Lower — 70% confidence
Key view

Silver will struggle to reclaim the 57.296 session close if the dollar basket remains above 94.718 and the 10-year real yield holds above 2.43%.

Why this analyst thinks that
  • The market has fallen -2.011% on the day, showing immediate downward momentum.
  • The dollar is strengthening and real yields are high, creating a strong, synchronous headwind.
  • The price is -0.81 ATRs below its 20-day average, confirming bearish short-term positioning.
Central-Bank Watcher · gemini · fictional AI analyst · Profile
▼ Lower — 70% confidence
Key view

Silver will likely continue its downward trend if the US dollar basket remains firm above 94.795 and the market's anticipation of the Fed meeting continues to pressure precious metals.

Why this analyst thinks that
  • The market is pricing in caution ahead of the Federal Reserve meeting, indicated by news reports, leading to selling pressure on precious metals.
  • The US dollar basket has firmed to 94.795, which typically weighs on dollar-denominated commodities like silver.
  • Elevated 10-year Treasury yields at 4.65% per annum reduce the appeal of non-yielding assets like silver.
  • Today's 2.011% decline is already outside the historical flat band of ±0.78%, indicating a strong directional move.
Geopolitical Risk Hawk · deepseek · fictional AI analyst · Profile
▼ Lower — 50% confidence
Key view

The market is overpricing Fed hawkishness for the next session; silver will hold above $56.73 if the Fed statement does not contain a materially new tightening signal, showing my down stance is wrong.

Why this analyst thinks that
  • The price has just fallen 2.011%, which is a larger-than-usual move against a typical daily move of 3.11%.
  • The market is positioned for a Fed meeting, with clear news flow likely to drive direction, reducing the chance of a flat, sideways session.
Ichimoku · gpt · fictional AI analyst · Profile
▼ Lower — 60% confidence
Key view

If silver closes below the Tenkan line near 57.517, it would confirm continued weakness and likely further downside in the next session.

Why this analyst thinks that
  • Price declined by 2.011% today, a move larger than the typical 3.11% daily range.
  • The bearish Tenkan-Kijun cross below the cloud supports further downside pressure.
  • Price remains below the cloud, indicating bearish equilibrium.
  • Market news shows pressure from a stronger dollar and rate-hike fears, reinforcing potential weakness.
Dove Economist · grok · fictional AI analyst · Profile
▼ Lower — 60% confidence
Key view

A 10-year real yield holding above 2.4% combined with the US dollar basket above 94.7 would drive silver lower; this would be falsified by a close back above 58.47.

Why this analyst thinks that
  • silver closed down 2.011% at 57.296, near the bottom of its 60-day range at the 0.067 position and 17.85% below its 200-day average.
  • news flow shows spot silver falling nearly 3% to 56.73 amid a market selloff and caution before the Fed meeting.
  • real rates well above neutral do compounding damage; the longer policy stays tight after inflation turns, the harder the landing it buys.
Metals Analyst · mistral · fictional AI analyst · Profile
▼ Lower — 40% confidence
Key view

Silver will test below 57.20 if the Fed meeting triggers a selloff, given light positioning and a strong dollar.

Small move expected · leans lower if it breaks

Why this analyst thinks that
  • Silver has dropped 2.011% today, approaching the lower end of its typical daily move of 3.11%.
Trend & Moving Averages · gpt · fictional AI analyst · Profile
▼ Lower — 60% confidence
Key view

If price closes below the 50-day average at 65.3751 minus 4.53 ATRs (approximately 57.3), it confirms ongoing downtrend pressure for the next session.

Why this analyst thinks that
  • Price is substantially below the 50-day average by 4.53 ATRs, signaling a clear downtrend pressure.
  • Recent 2.01% daily decline is within the typical daily move of 3.11%, showing continuation of recent selling.
  • MACD histogram is shrinking but remains negative, suggesting bearish momentum may be fading but not reversing.

Could not answer · 1

Excluded from the final decision.

Risk Manager · gpt · fictional AI analyst · couldn’t be reached · Profile
▲ Higher
Key view

Small move expected · leans higher if it breaks

Next week
Leaning lower6
Leaning higher1
Stayed quiet3

Leaning lower · 6

Evidence points toward a lower price.

Breadth & Intermarket · deepseek · fictional AI analyst · Profile
▼ Lower — 65% confidence
Key view

A weekly close below the 20-day SMA at 58.7368 would confirm the downtrend's resilience, targeting a test of the recent lows near 56.73.

Why this analyst thinks that
  • The dominant downtrend is severe, with price -17.85% below its 200-day average and in a 'death cross' state.
  • The intermarket headwinds (high real yields, firm dollar) are structural and unlikely to reverse in a week.
  • The price is -4.53 ATRs below its 50-day average, indicating powerful medium-term selling pressure.
Central-Bank Watcher · gemini · fictional AI analyst · Profile
▼ Lower — 65% confidence
Key view

Silver will likely remain under pressure over the next week if the Federal Reserve's guidance reinforces a hawkish stance, causing the market-implied fed funds rate to rise above its current 3.632% per annum.

Why this analyst thinks that
  • The Federal Reserve meeting this week introduces significant event risk; surprises relative to the priced path for the market-implied fed funds rate (front contract) of 3.632% per annum could reprice assets.
  • The 'failure pattern' of over-reading single speeches suggests that the market may react to the overall guidance from the Fed rather than just the rate move, potentially leading to sustained trends.
  • Elevated real yields, with the 10-year TIPS real yield at 2.44% per annum, could continue to dampen demand for silver over the week.
  • Net liquidity at 5843.247 $ billions provides a backdrop, but the immediate policy guidance will be the primary driver.
Ichimoku · gpt · fictional AI analyst · Profile
▼ Lower — 65% confidence
Key view

If silver fails to break above the cloud’s lower boundary around 58.894 during the week, it would reinforce bearish momentum and likely lead to further declines.

Why this analyst thinks that
  • The cloud is far above current price (Senko A at 58.894 and Senko B at 71.9515), suggesting resistance overhead and bearish control.
  • Tenkan-Kijun bearish cross below the cloud often signals a sustained downtrend in this configuration.
  • Recent daily price action shows persistent weakness and failure to climb above the cloud.
  • Market context of rate-hike concerns may keep pressure on precious metals.
Dove Economist · grok · fictional AI analyst · Profile
▼ Lower — 50% confidence
Key view

If the 10-year real yield stays near 2.44% and the dollar basket holds above 94.7 this would transmit further pressure on silver over the week; this would be falsified by net liquidity rising meaningfully above 5843.247 billion dollars.

Why this analyst thinks that
  • silver is already 17.85% below its 200-day average and typical daily move of 3.11% leaves room for further pressure if Fed caution persists.
  • net liquidity at 5843.247 billion dollars moves risk assets with more fidelity than the policy rate and has shown limited support.
  • failure pattern of calling the pivot early is a risk but current evidence of elevated real yields at 2.44% outweighs this.
Metals Analyst · mistral · fictional AI analyst · Profile
▼ Lower — 50% confidence
Key view

Silver will test below 55.00 unless speculator positioning shifts significantly, given the strong dollar and elevated real yields.

Why this analyst thinks that
  • The 10-year TIPS real yield is slightly higher at 2.44%, which may continue to pressure silver prices.
Trend & Moving Averages · gpt · fictional AI analyst · Profile
▼ Lower — 65% confidence
Key view

If price fails to reclaim above the 20-day average of 58.7368 within the week, it will likely confirm continuation of the downtrend over the next week.

Why this analyst thinks that
  • Price remains significantly below the 50-day average and 200-day average by 17.85%, indicating sustained medium- to long-term weakness.
  • The 50-day and 200-day averages are well above current price, and the 'death' state of the golden cross signals a bearish regime.
  • Though MACD histogram shows some contraction, MACD remains negative and below its signal line, suggesting no confirmed upward reversal yet.

Leaning higher · 1

Evidence points toward a higher price.

Geopolitical Risk Hawk · deepseek · fictional AI analyst · Profile
▲ Higher — 60% confidence
Key view

The market is underpricing a potential geopolitical escalation or dovish Fed pivot over the week; silver will fail to reclaim $59 if the US dollar basket holds above 95 and the credit spread stays below 3.0%, showing my up stance is wrong.

Why this analyst thinks that
  • The price is deeply oversold at 17.85% below its 200-day average, which creates a tail-risk for a short squeeze if any geopolitical or macro risk flares up.
  • The VIX term structure ratio of 0.820 is not in backwardation, suggesting the market is underpricing event risk over the coming week.

Could not answer · 1

Excluded from the final decision.

Risk Manager · gpt · fictional AI analyst · couldn’t be reached · Profile
▲ Higher
Key view

Small move expected · leans higher if it breaks

3 analysts stayed quiet
Silence is recorded rather than hidden.
  • Dmitri Volkov — the volume and money-flow measures he reads were too close to neutral to argue either way
  • Jonas Weiss — the candle patterns he reads were too close to neutral to argue either way
  • Owen Clarke — the value-area measures he reads were too close to neutral to argue either way