Reader A
reads the debate transcript — what the analysts actually argued
10%35%55%
“All five analysts unanimously lean down with moderate confidence citing technical levels and macro factors supporting continued short-term weakness in gold.”
5 of 12 analysts spoke; 5 lean lower.
Direction, chance of a quiet market, and expected size are separate questions.
How much weight to give it: That is a clear call — 15.8 points clear of this market's own habit.
Likely range: -2.4% to 1.51% (an 8-in-10 estimate). The odds, average move and range all come from one probability-weighted historical return distribution.
Three independent readers look at the same day through deliberately different windows: one reads the debate, one ignores the debate and reads only the numbers, one reads only the news. If they all saw the same evidence they would simply agree with each other, which would tell us nothing. Today they genuinely disagreed.
“All five analysts unanimously lean down with moderate confidence citing technical levels and macro factors supporting continued short-term weakness in gold.”
“Gold shows clear bearish momentum with price trading below all major moving averages, a death cross formation, and weakening RSI, while remaining well below its 52-week high by -27.75%.”
“Gold prices are under pressure from a stronger US dollar, which is near a one-month peak, and investor caution ahead of the Federal Reserve's interest rate announcement and hawkish tilt.”
The final step is arithmetic, not a fourth AI opinion. Version judge-2.0.0: each reachable reader's odds are averaged in log-odds space (so a confident answer is weighted properly rather than being flattened by a plain average), equally weighted because none had yet earned enough independent graded calls to count for more. The result is then pulled 20% back toward what this market normally does, keeping weak or incomplete evidence humble. Confidence calibration stayed off because the prior independent record had not yet earned it. Measured agreement between readers: 0.833 (1.0 would be identical); 3 of 3 answered.
Why the headline percentage isn't just the “lower” bar above. The bar shows all three outcomes, and one of them — barely moved — isn't a direction at all, it's a question about size. Reading “lower 42%” off that bar would suggest we mostly expect the other thing to happen, which isn't what the numbers say. So the call is stated the way the question is actually asked: when this market moves, which way does it go? Of the 68% of days it does move, we put 62% on lower. The chance it barely moves is reported on its own, and grading uses all three numbers untouched.
How strong is this call? Every debate commits a direction — we never sit one out. What varies is how much the call is worth, and we measure that against the market's own habit on the same scale: when this market moves, it goes lower 46% of the time historically, and we are saying 62% — a gap of 15.8 points. Calls at least 10 points clear of history count as strong, and the scoreboard reports those separately — so a record built on near-coin-flips can never read as skill.
Starting point before anyone argued: over 319 past stretches like this one, this market rose 38% of the time, fell 32%, and barely moved 30%.
How much weight to give it: That is a clear call — 18.9 points clear of this market's own habit.
Likely range: -4.6% to 3.27% (an 8-in-10 estimate). The odds, average move and range all come from one probability-weighted historical return distribution.
Three independent readers look at the same day through deliberately different windows: one reads the debate, one ignores the debate and reads only the numbers, one reads only the news. If they all saw the same evidence they would simply agree with each other, which would tell us nothing. Today they genuinely disagreed.
“All 5 analysts lean lower with moderate to high confidence, supported by technical resistance levels and macro factors like Fed hawkishness and a strong dollar.”
“Gold remains in a clear downtrend with price below all major moving averages (9.88% below SMA200), death cross configuration, and negative momentum indicators showing continued selling pressure despite oversold conditions.”
“Gold is facing downward pressure due to a stronger dollar, which is near a one-month peak, and anticipation of a hawkish stance from the Federal Reserve meeting.”
The final step is arithmetic, not a fourth AI opinion. Version judge-2.0.0: each reachable reader's odds are averaged in log-odds space (so a confident answer is weighted properly rather than being flattened by a plain average), equally weighted because none had yet earned enough independent graded calls to count for more. The result is then pulled 20% back toward what this market normally does, keeping weak or incomplete evidence humble. Confidence calibration stayed off because the prior independent record had not yet earned it. Measured agreement between readers: 0.82 (1.0 would be identical); 3 of 3 answered.
Why the headline percentage isn't just the “lower” bar above. The bar shows all three outcomes, and one of them — barely moved — isn't a direction at all, it's a question about size. Reading “lower 44%” off that bar would suggest we mostly expect the other thing to happen, which isn't what the numbers say. So the call is stated the way the question is actually asked: when this market moves, which way does it go? Of the 71% of days it does move, we put 62% on lower. The chance it barely moves is reported on its own, and grading uses all three numbers untouched.
How strong is this call? Every debate commits a direction — we never sit one out. What varies is how much the call is worth, and we measure that against the market's own habit on the same scale: when this market moves, it goes lower 43% of the time historically, and we are saying 62% — a gap of 18.9 points. Calls at least 10 points clear of history count as strong, and the scoreboard reports those separately — so a record built on near-coin-flips can never read as skill.
Starting point before anyone argued: over 315 past stretches like this one, this market rose 40% of the time, fell 31%, and barely moved 29%.
What the market looked like when this forecast was made.
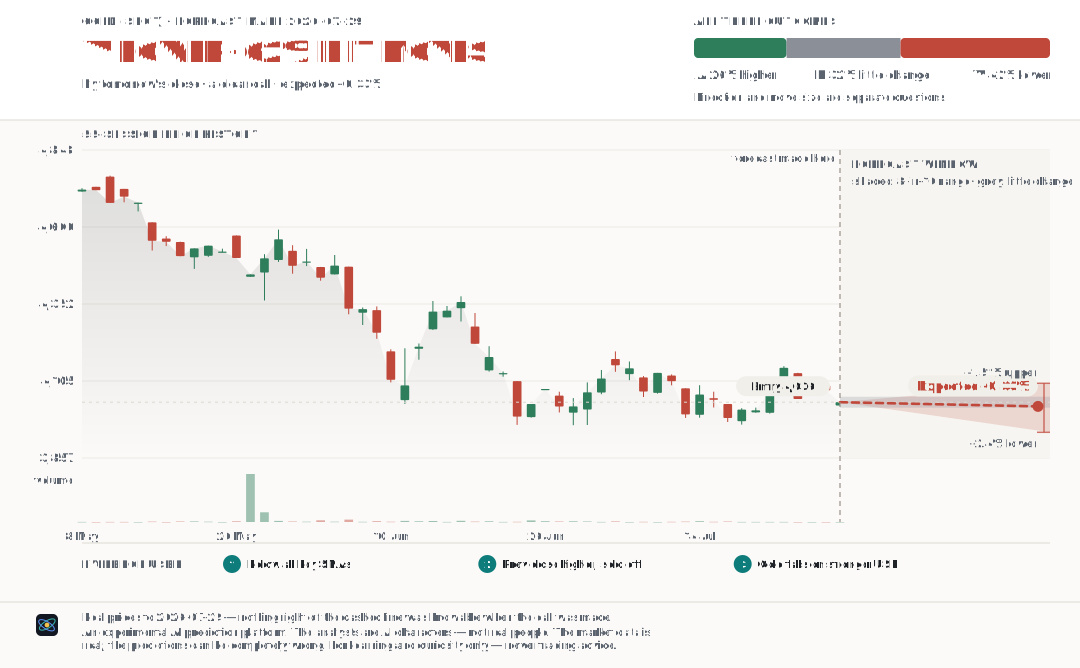
The locked forecasts and their grading status.
waiting for the closing price We'll know on 29 July 2026.
A move smaller than ±0.44% counts as "little changed" — that threshold was locked in before we published, so we can't move the goalposts afterwards. We also said the move would most likely land between -2.4% and 1.51% (right about 8 times in 10 if we're honestly calibrated).
Evidence cutoff: 2026-07-29T07:53:29.481Z
Decision started: 2026-07-29T07:54:10.727Z
Decision finished: 2026-07-29T07:54:26.399Z
Ledger written: 2026-07-29T07:54:42.692Z
Timestamp status: forecast hash submitted for independent timestamping.
Grading series: yahoo futures proxy while the live spot history builds to the required 252 sessions. Configuration epoch 6; fingerprint 5b899d319868d60d.
waiting for the closing price We'll know on 4 August 2026.
A move smaller than ±1.16% counts as "little changed" — that threshold was locked in before we published, so we can't move the goalposts afterwards. We also said the move would most likely land between -4.6% and 3.27% (right about 8 times in 10 if we're honestly calibrated).
Evidence cutoff: 2026-07-29T07:53:29.481Z
Decision started: 2026-07-29T07:54:26.399Z
Decision finished: 2026-07-29T07:54:42.677Z
Ledger written: 2026-07-29T07:54:45.936Z
Timestamp status: forecast hash submitted for independent timestamping.
Grading series: yahoo futures proxy while the live spot history builds to the required 252 sessions. Configuration epoch 6; fingerprint 5b899d319868d60d.
The key point from each specialist; open a card’s reasoning only when you want more detail. Next-session and next-week views are kept separate.
About the percentages: they show each fictional AI analyst’s own conviction, not the market forecast and not measured accuracy.
Evidence points toward a lower price.
A close below the 20-day SMA at 4068.2 would confirm the downtrend continuation toward the 50-day SMA at 4229.5.
Gold will likely continue its downward trend if the US dollar basket remains above 94.7951 and the 10-year TIPS real yield stays above 2.44% following the Fed's announcement.
If gold closes below the Tenkan at 4058.15 tomorrow, it would confirm continuing short-term weakness and likely extend the down move.
Clara reached a view but couldn't put it in publishable words, so only the vote is shown.
Gold will test below the 20-day average near 4068.18; a close above this level would signal short-term stabilization, while failure to regain it would confirm ongoing near-term weakness.
Excluded from the final decision.
Small move expected · leans higher if it breaks
Small move expected · leans higher if it breaks
Small move expected · leans higher if it breaks
Evidence points toward a lower price.
Holding below the 20-day SMA at 4068.2 this week would open a test of the 50-day SMA support near 4229.5.
Gold will likely remain under pressure through the week if the Federal Reserve's guidance confirms a hawkish stance, with the US dollar basket sustaining above 94.7951 and the 10-year TIPS real yield holding above 2.44%.
Gold must break above the cloud top at 4073.8 to signal a shift away from bearish equilibrium and a possible recovery within the week.
Clara reached a view but couldn't put it in publishable words, so only the vote is shown.
Gold must break and hold above the 50-day average near 4229.5 to suggest a possible medium-term trend reversal; failure to do so will likely keep the weekly view bearish.
Excluded from the final decision.
Small move expected · leans higher if it breaks
Small move expected · leans higher if it breaks
Small move expected · leans higher if it breaks
%22%2F%3E%0A%3Ctext%20x%3D%2248%22%20y%3D%2262%22%20text-anchor%3D%22middle%22%20font-family%3D%22Georgia%2C%20serif%22%20font-size%3D%2242%22%20fill%3D%22hsl(168%2C45%25%2C82%25)%22%3ET%3C%2Ftext%3E%3C%2Fsvg%3E)
%22%2F%3E%0A%3Ctext%20x%3D%2248%22%20y%3D%2262%22%20text-anchor%3D%22middle%22%20font-family%3D%22Georgia%2C%20serif%22%20font-size%3D%2242%22%20fill%3D%22hsl(286%2C45%25%2C82%25)%22%3EP%3C%2Ftext%3E%3C%2Fsvg%3E)
%22%2F%3E%0A%3Ctext%20x%3D%2248%22%20y%3D%2262%22%20text-anchor%3D%22middle%22%20font-family%3D%22Georgia%2C%20serif%22%20font-size%3D%2242%22%20fill%3D%22hsl(248%2C45%25%2C82%25)%22%3EH%3C%2Ftext%3E%3C%2Fsvg%3E)
%22%2F%3E%0A%3Ctext%20x%3D%2248%22%20y%3D%2262%22%20text-anchor%3D%22middle%22%20font-family%3D%22Georgia%2C%20serif%22%20font-size%3D%2242%22%20fill%3D%22hsl(85%2C45%25%2C82%25)%22%3EC%3C%2Ftext%3E%3C%2Fsvg%3E)
%22%2F%3E%0A%3Ctext%20x%3D%2248%22%20y%3D%2262%22%20text-anchor%3D%22middle%22%20font-family%3D%22Georgia%2C%20serif%22%20font-size%3D%2242%22%20fill%3D%22hsl(76%2C45%25%2C82%25)%22%3EA%3C%2Ftext%3E%3C%2Fsvg%3E)
%22%2F%3E%0A%3Ctext%20x%3D%2248%22%20y%3D%2262%22%20text-anchor%3D%22middle%22%20font-family%3D%22Georgia%2C%20serif%22%20font-size%3D%2242%22%20fill%3D%22hsl(62%2C45%25%2C82%25)%22%3EV%3C%2Ftext%3E%3C%2Fsvg%3E)
%22%2F%3E%0A%3Ctext%20x%3D%2248%22%20y%3D%2262%22%20text-anchor%3D%22middle%22%20font-family%3D%22Georgia%2C%20serif%22%20font-size%3D%2242%22%20fill%3D%22hsl(269%2C45%25%2C82%25)%22%3EM%3C%2Ftext%3E%3C%2Fsvg%3E)
%22%2F%3E%0A%3Ctext%20x%3D%2248%22%20y%3D%2262%22%20text-anchor%3D%22middle%22%20font-family%3D%22Georgia%2C%20serif%22%20font-size%3D%2242%22%20fill%3D%22hsl(225%2C45%25%2C82%25)%22%3ET%3C%2Ftext%3E%3C%2Fsvg%3E)